Project Overview
MLIT Infrastructure Visualization Tool is a high-performance web application built for the Ministry of Land, Infrastructure, Transport and Tourism. We handled the end-to-end UI/UX redesign and frontend development to modernize a legacy road and railroad management system into an agile, data-driven dashboard.
The Challenge
The primary hurdle was Data Density vs. Accessibility. The original legacy software was overwhelming for a diverse workforce (ages 20–70), leading to navigation fatigue and slow operational speeds. The goal was to consolidate complex "Railroad & Road" data into a modern interface that remains intuitive for all age groups.
Our Approach
- Inclusive Research: Collaborated with the Director to analyze user hurdles via staff surveys, focusing on high-contrast UI and clear information hierarchy to support a 50-year age gap in users.
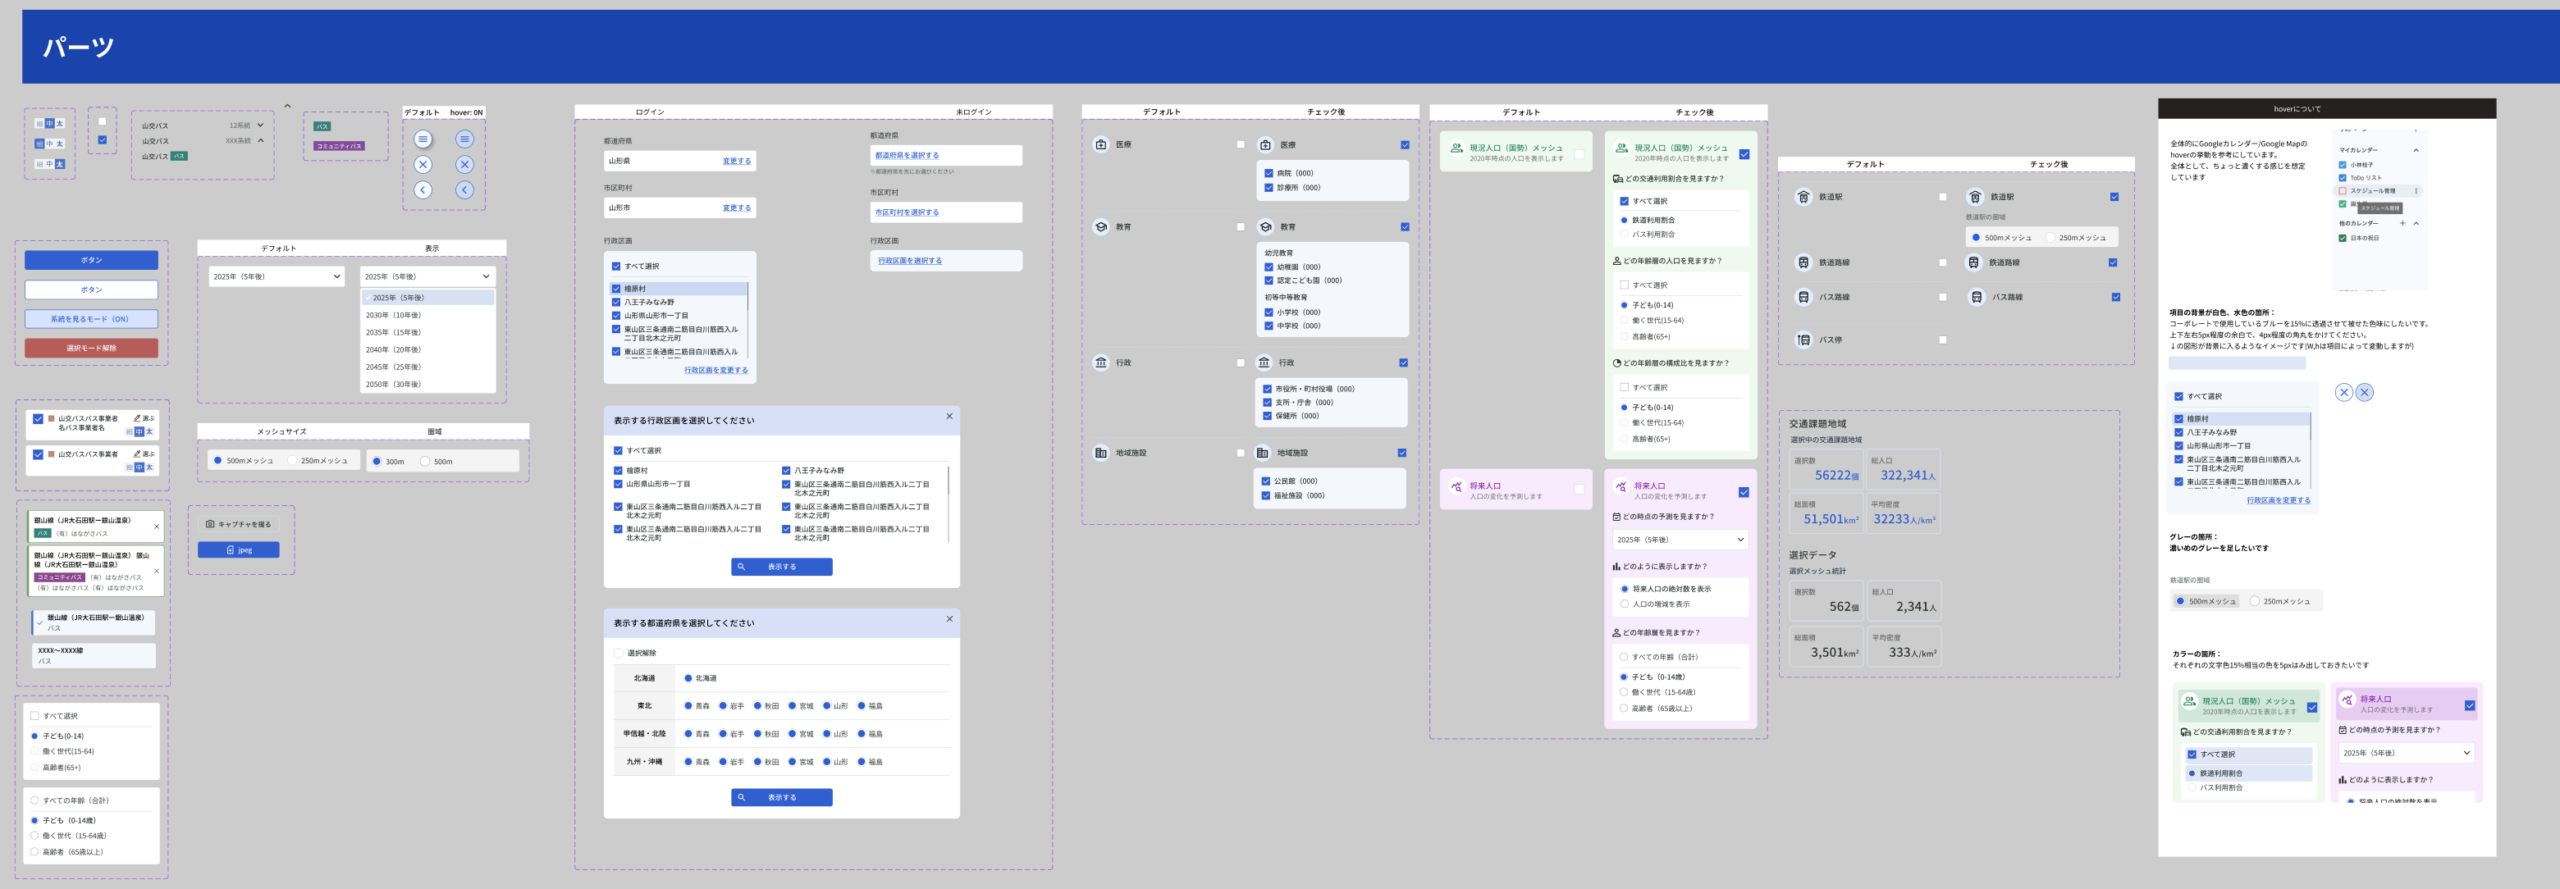
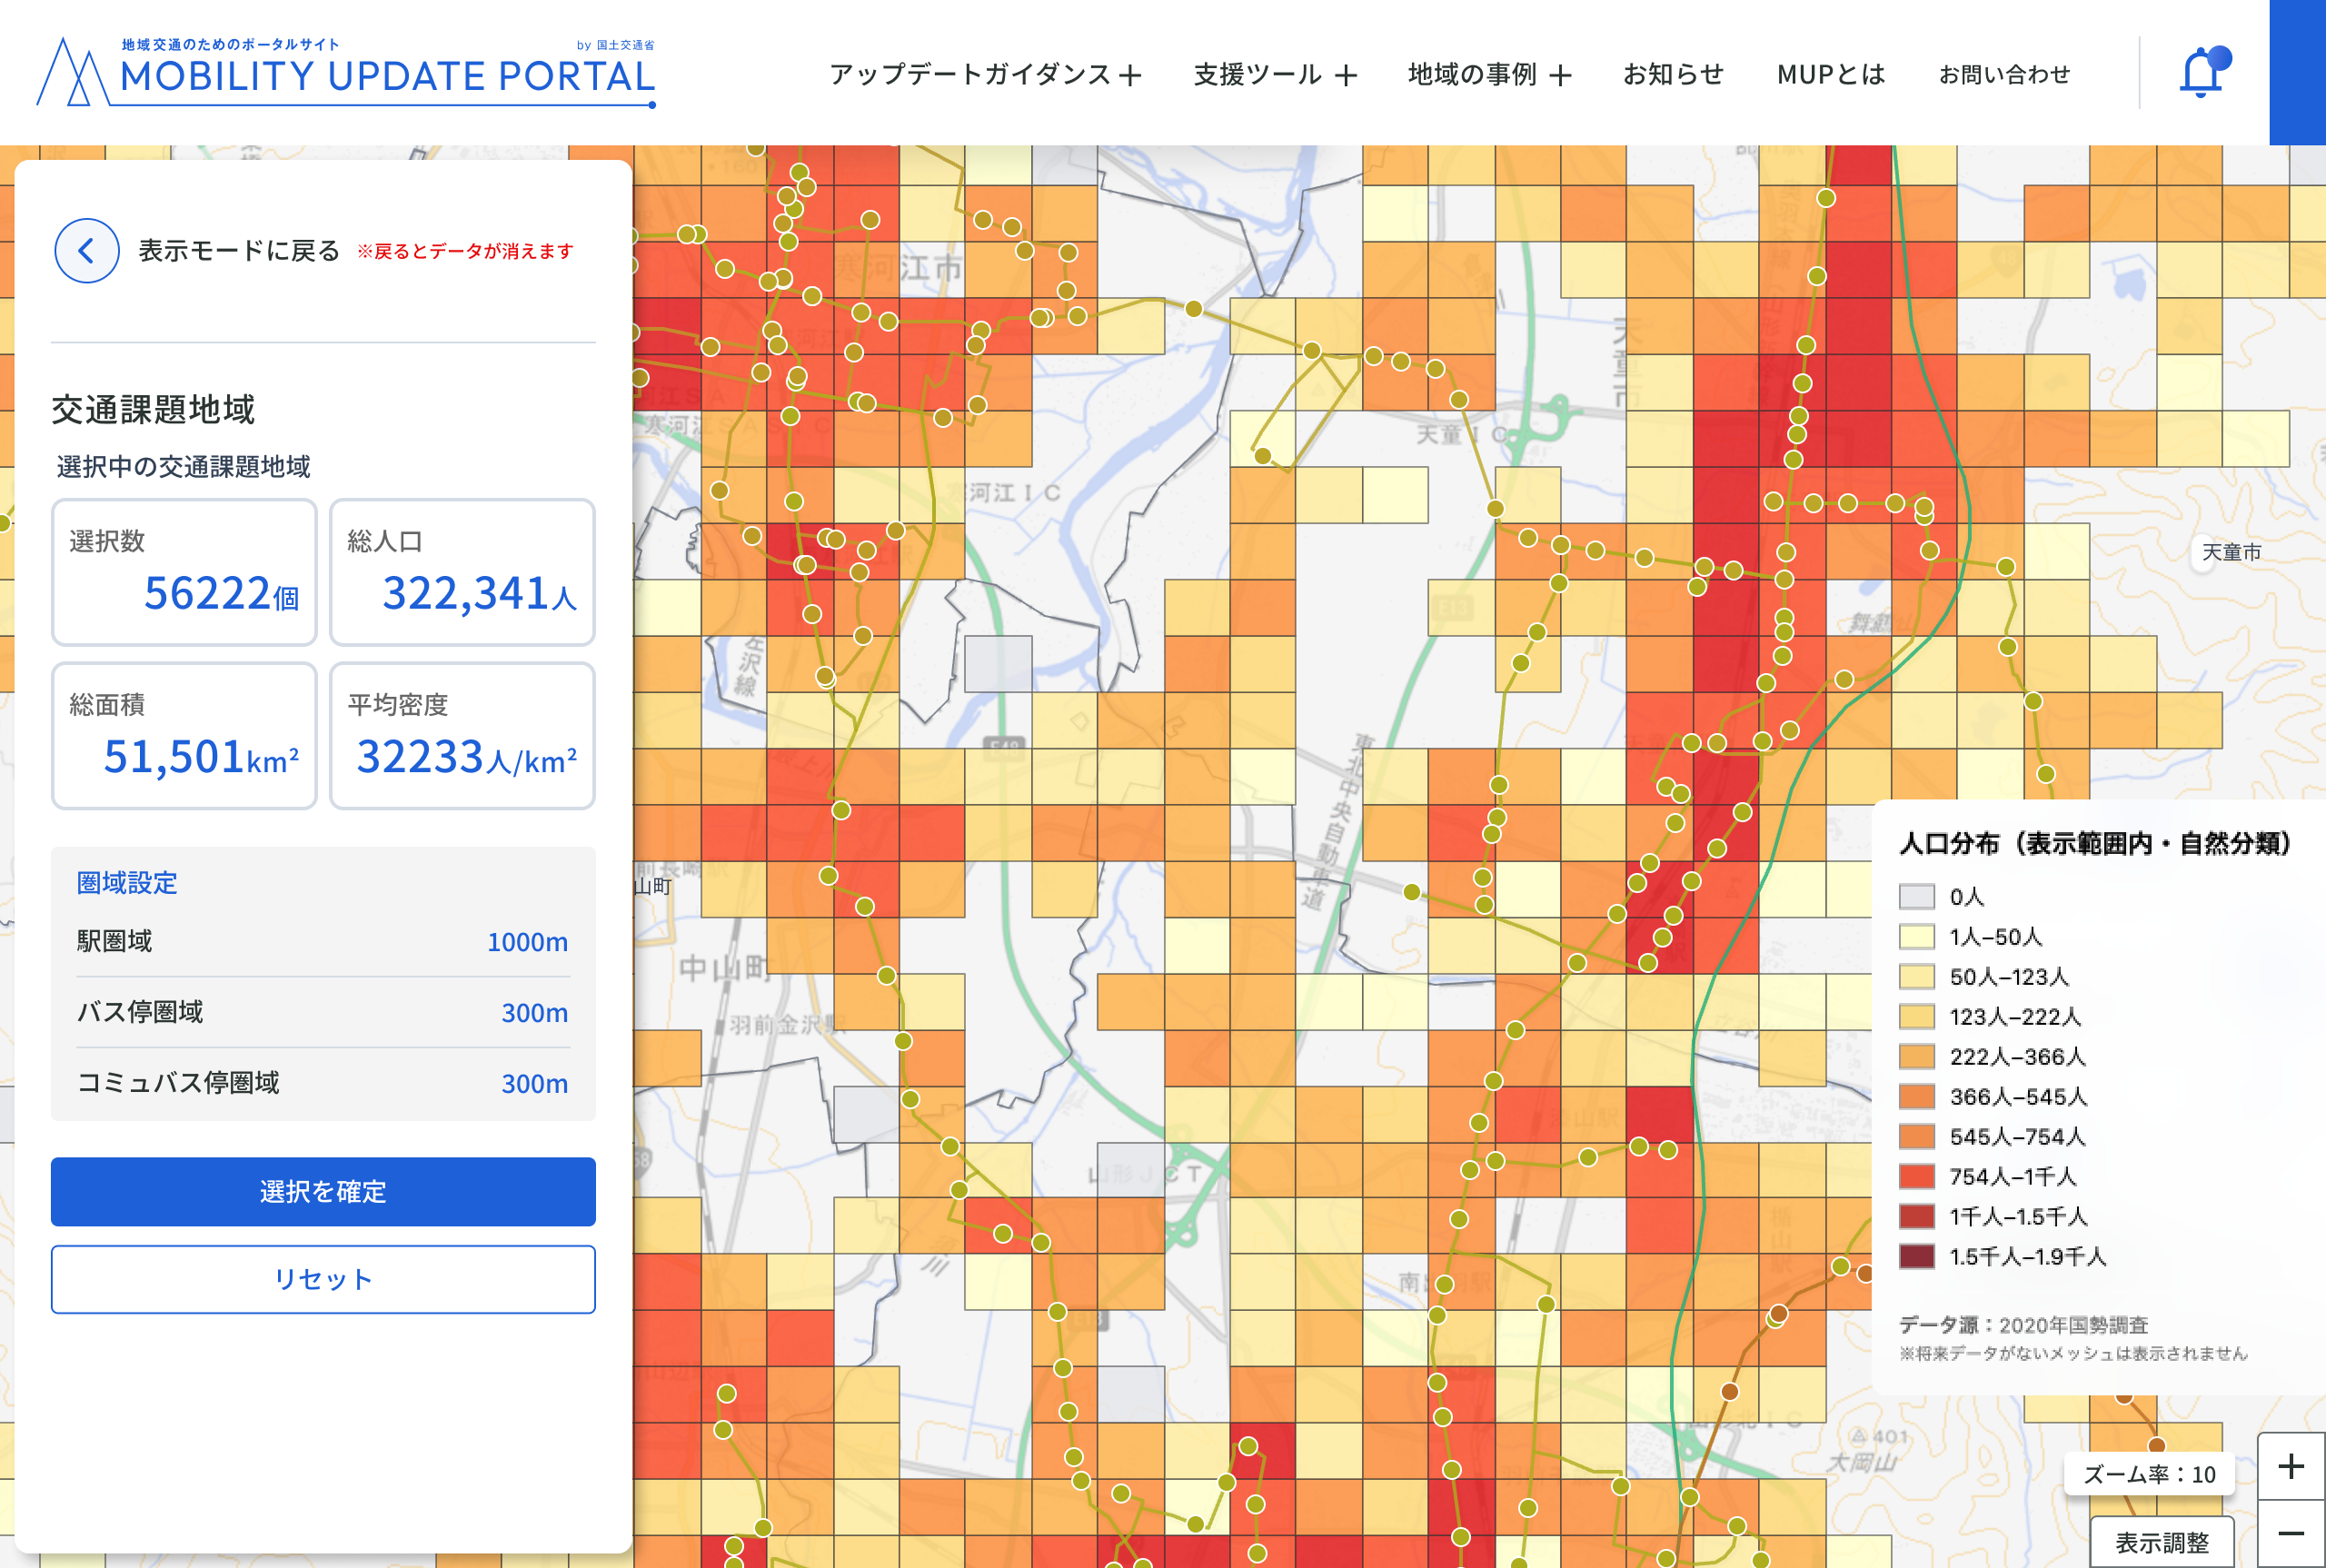
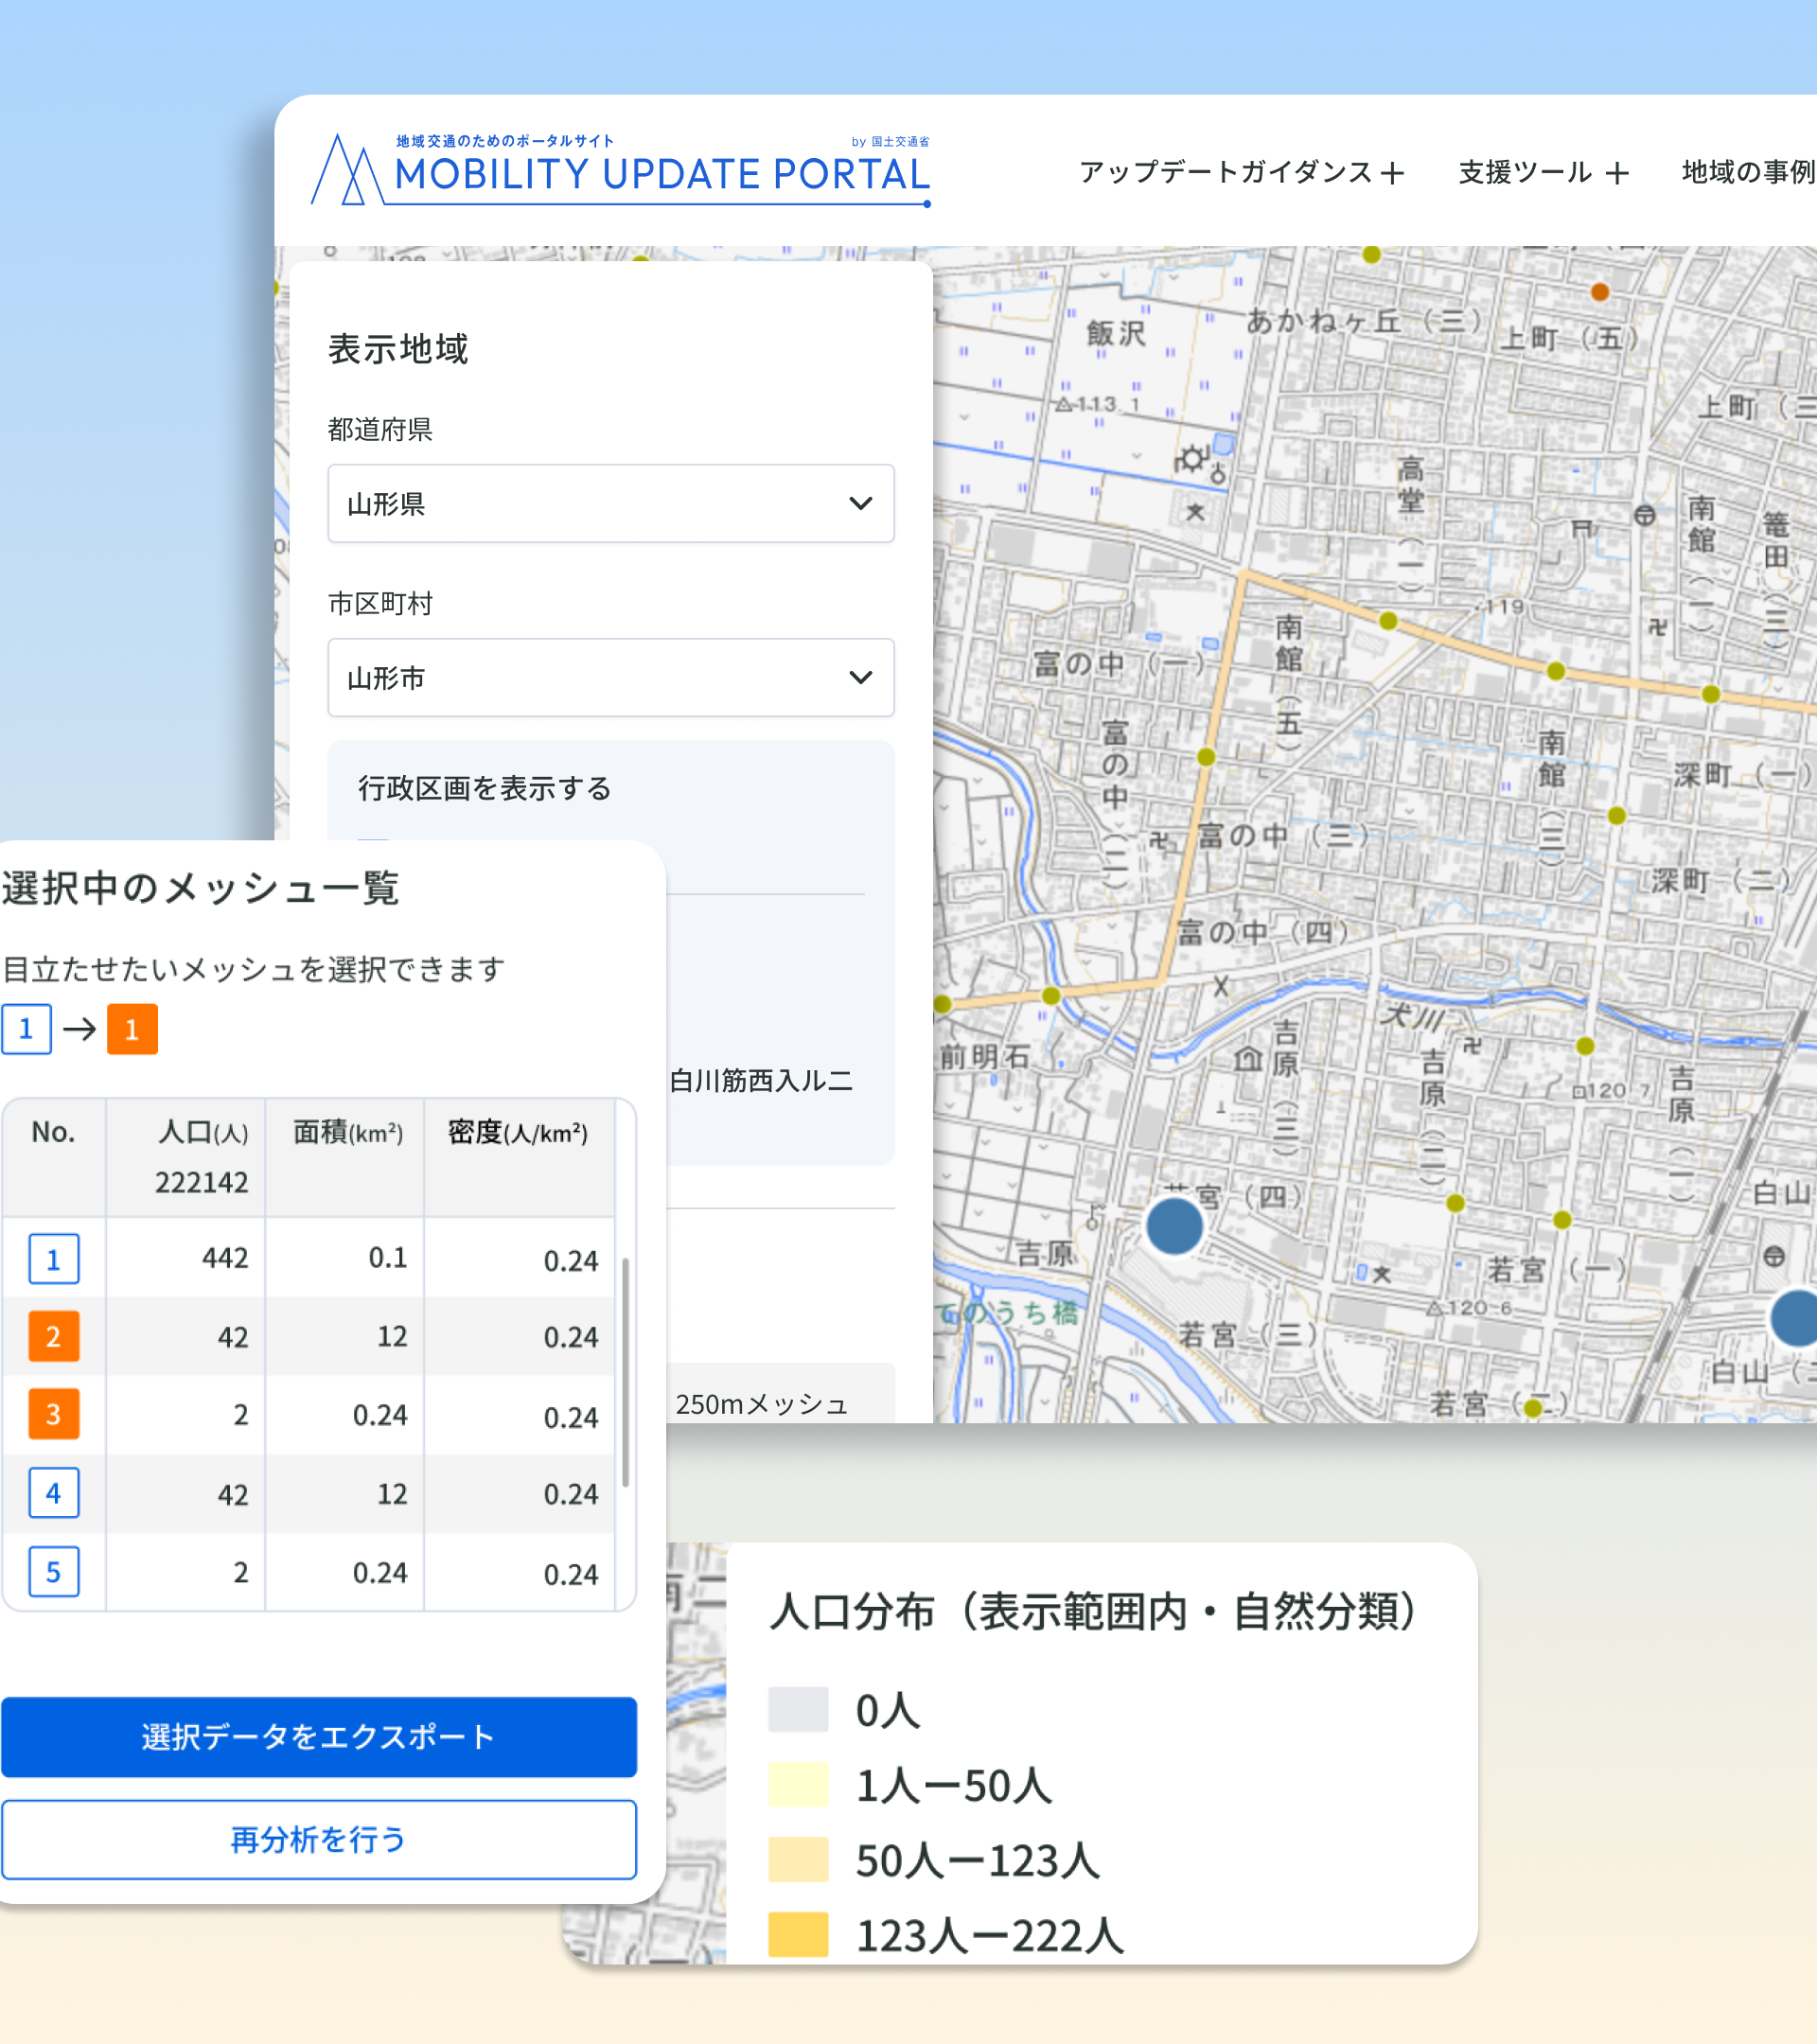
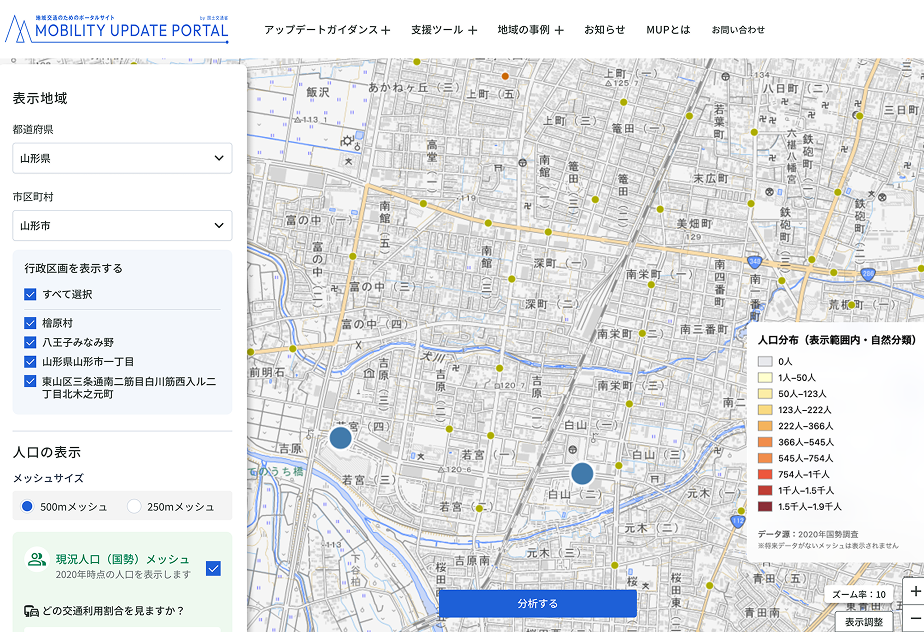
- Information Architecture: Designed and scaffolded the Command Center layout, including a persistent left-panel navigation system to ensure 3-click access to critical infrastructure data.
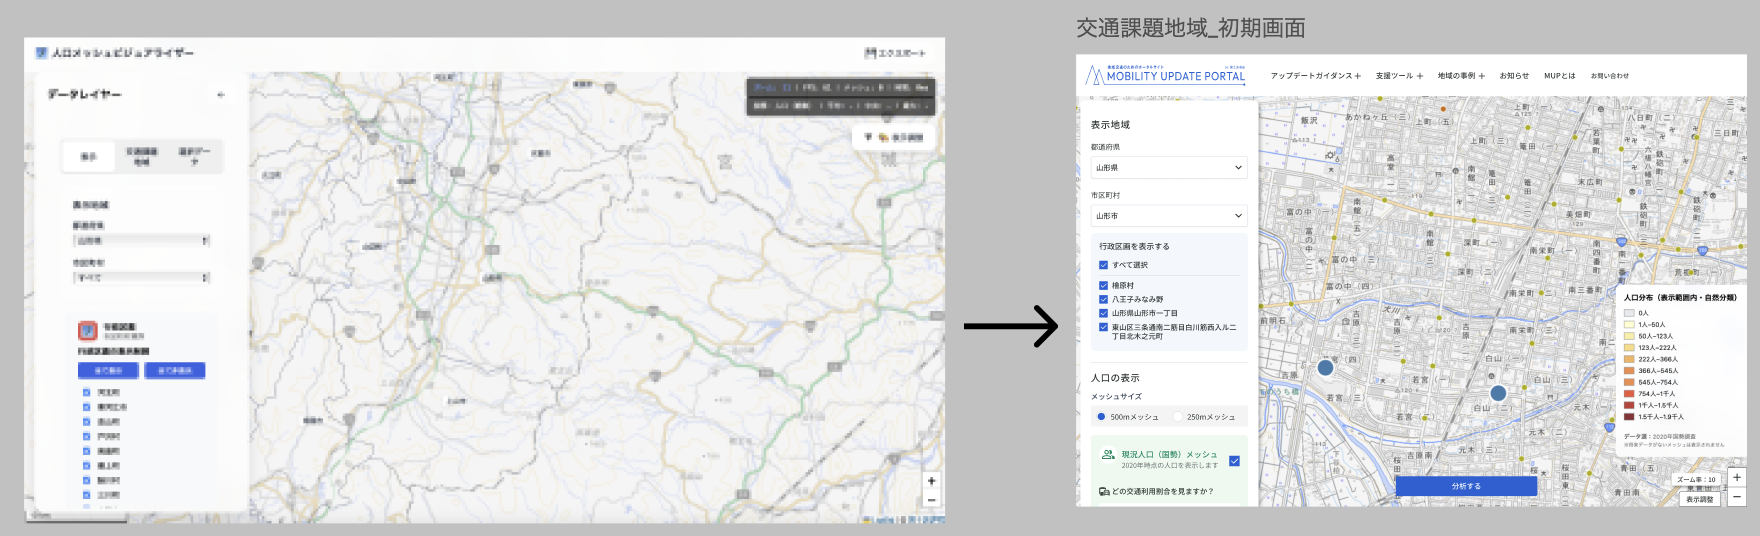
- Technical Migration: Transitioned from Vanilla/Legacy code to a modern React architecture. This improved system performance and enabled the dynamic rendering of complex visualization components.
- Cross-Functional Collaboration: Acted as the bridge between design and engineering, utilizing Figma to provide high-fidelity prototypes and technical documentation for a team of 5 developers, ensuring 100% design-to-code accuracy.
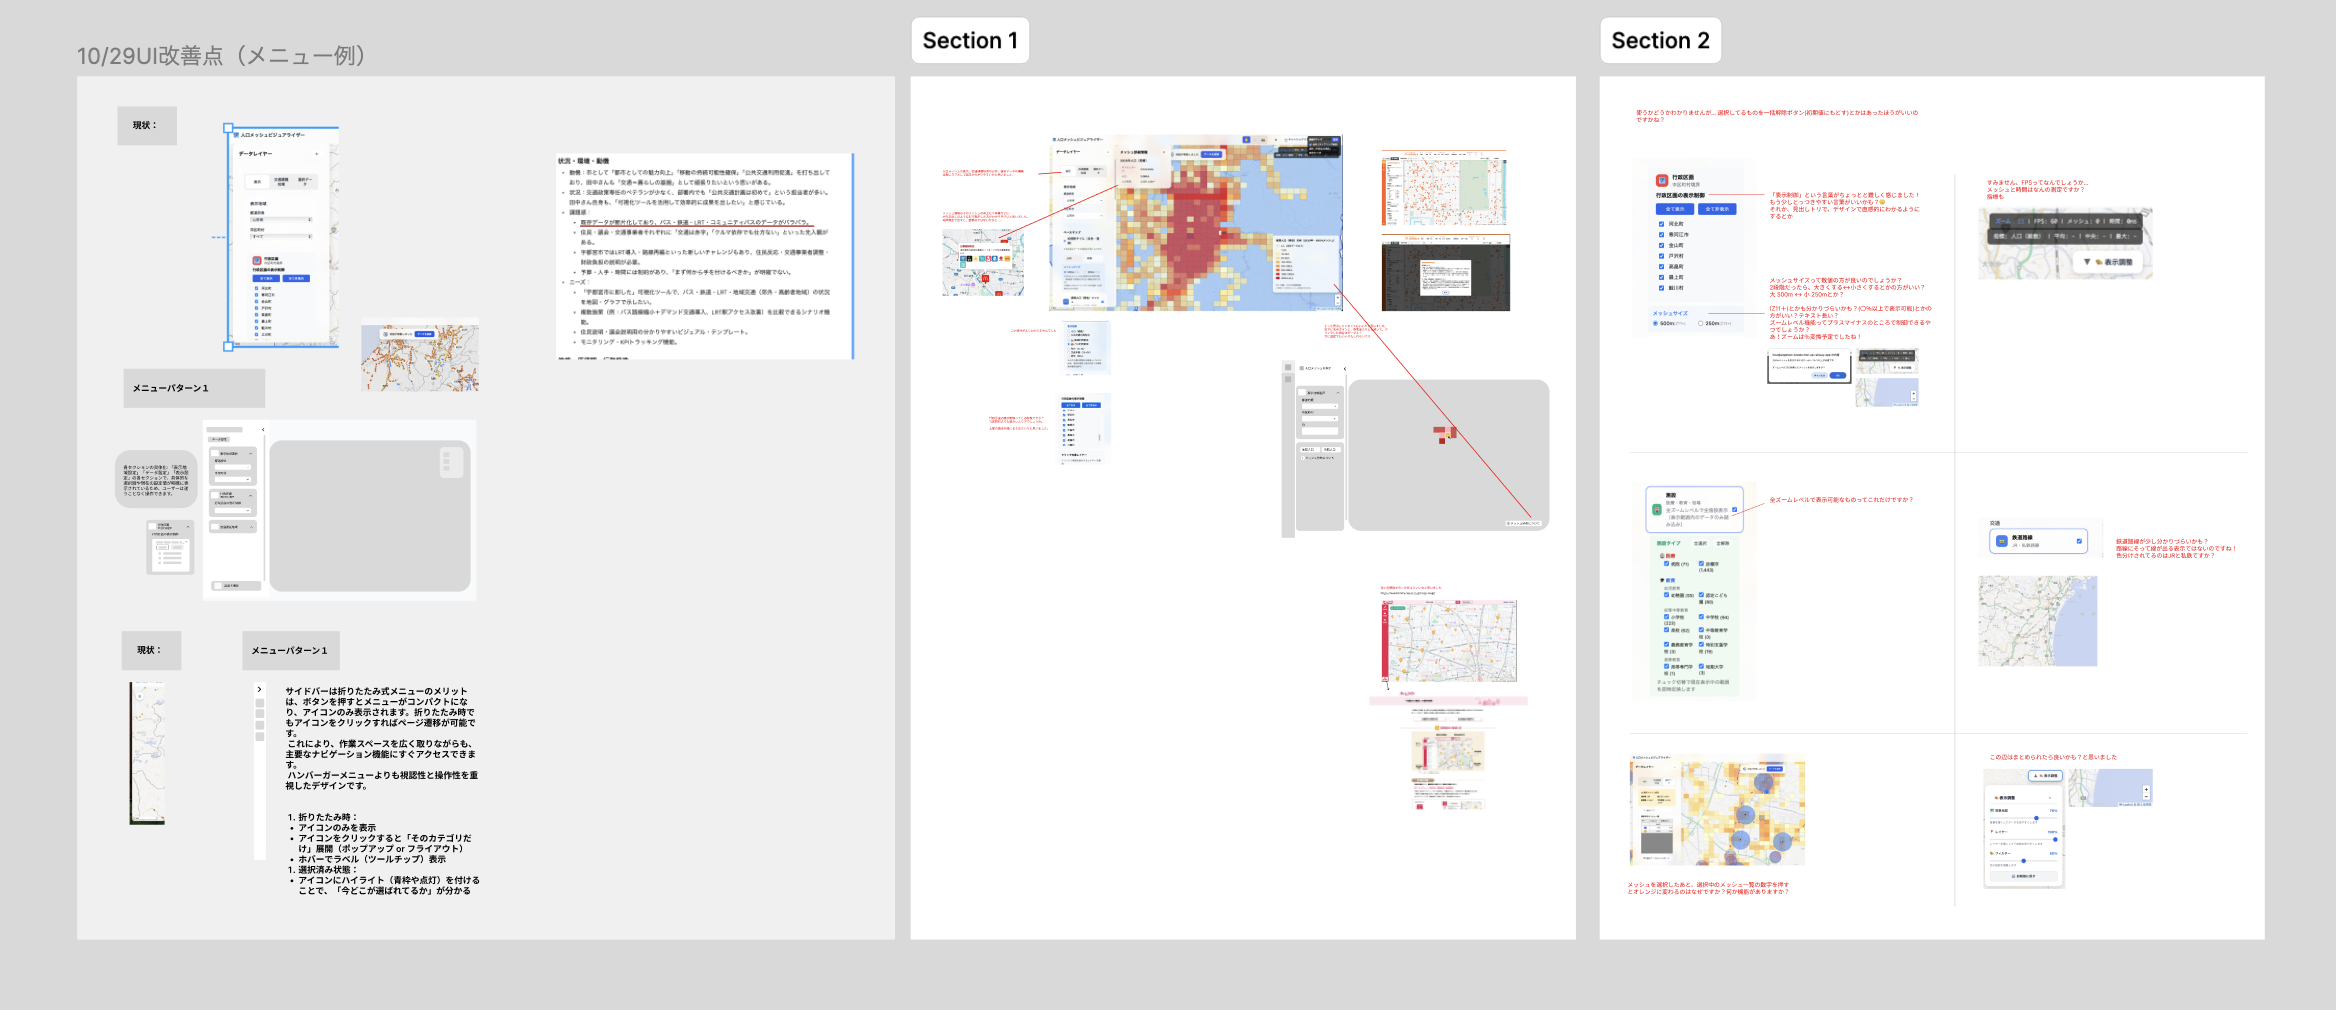
- Iterative Prototyping: Managed a rapid cycle of "Design > Discussion > Presentation" to ensure the final UI met strict government functional requirements.
- Performance and UX Decisions: Proposed two solutions that were approved and shipped. First, at zoom level 16 and above, bus stop and station SVG icons collapse to a single dot to prevent visual overload and improve rendering speed in dense areas like Tokyo. Second, when a last-minute issue was raised before launch where clients could not see the bus layer with all layers active, I proposed adding a dedicated bus layer opacity slider to the display settings panel, giving users independent control over each layer's visibility.
The Impact
As part of the team, I helped deliver and launch a live web tool now in active use, modernizing Japan's digital infrastructure. By implementing React, we provided the Ministry with a scalable, maintainable codebase that reduced technical debt and significantly improved the user experience for regional transport updates.
- Efficiency: Reduced user navigation steps by an estimated 60% through optimized Information Architecture.
- Performance: Achieved significantly faster dashboard load times and smoother data interaction via React state management.
- Inclusivity: Delivered a "Universal Design" interface that passed internal accessibility checks for both younger and senior Ministry staff.